IPEDS Retention Dashboard
IPEDS Retention Dashboard
First-time, full-time & part-time, degree seeking students fall-to-fall retention data from fall 2009 to current.
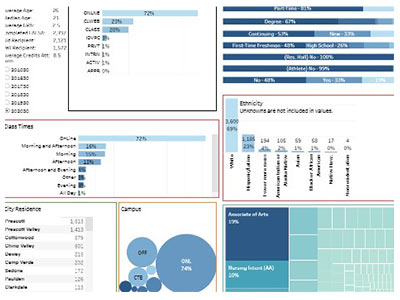
Dashboard Menu
Explore an array of dimensions and categories of Yavapai College student and employee data
Student Demographics
Dashboard provides headcount and percent of students with over 20 different dimensions or categories. Most categories are filters for analyzing data. Data is available for spring and fall terms only.
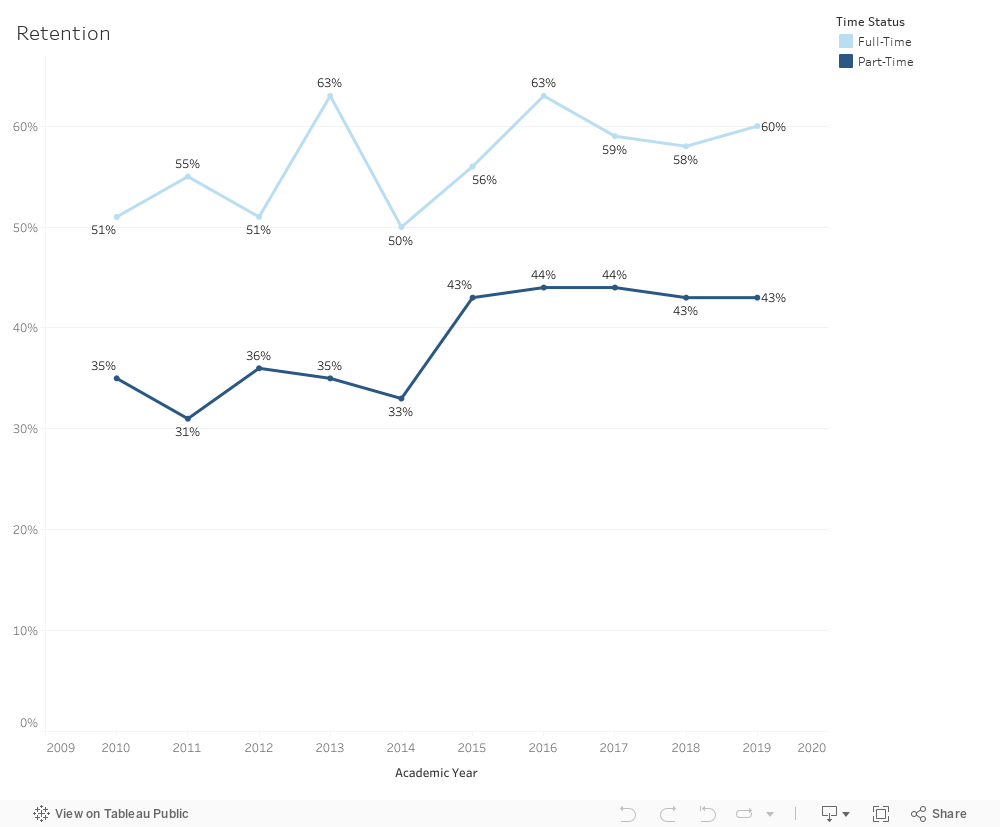
IPEDS Retention
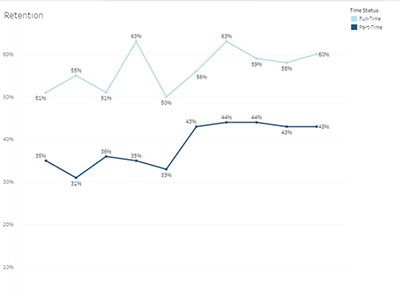
First-time, full-time & part-time, degree seeking students fall-to-fall retention data from fall 2009 to current.
YC Transfers
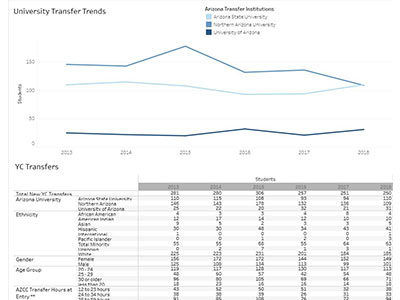
University transfer trends to ASU, NAU and UA. Students may have additional transfer hours from 2-year or 4-year postsecondary institutions.
Enrollment Trend
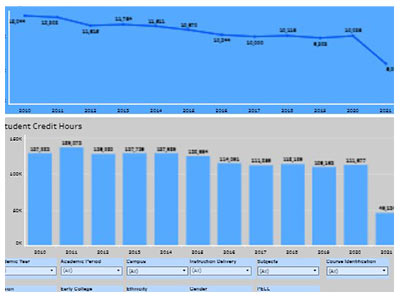
Measures unduplicated headcount and credits attempted from academic years 2009 through current year. 1
Graduate Summary
by Program
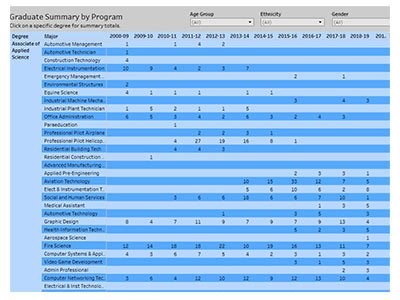
Degree and certificate awards earned by Yavapai college students over a 10-year period.
Demographics by Term
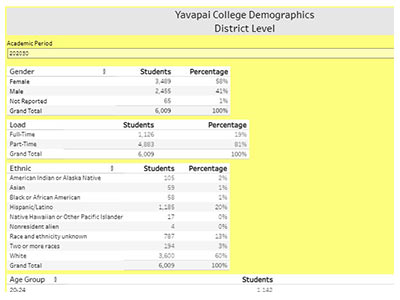
Unduplicated headcount and percentage of students for the district since fall 2009. Dimensions or categories include gender, race/ethnicity, residence, time-status and age group. Data is available for all terms.
Retention
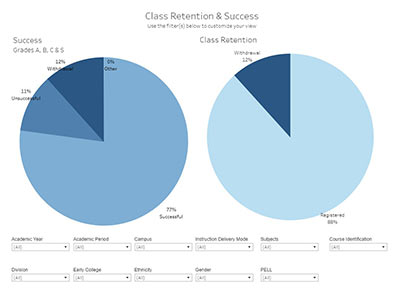
Retention shows the percentage of student completion and student withdrawal from courses. The student success measure shows the percentage of successful students (grades A, B, C or pass) versus withdrawals and unsuccessful students (grades D, F, and non-pass) 1.
Average Class Size
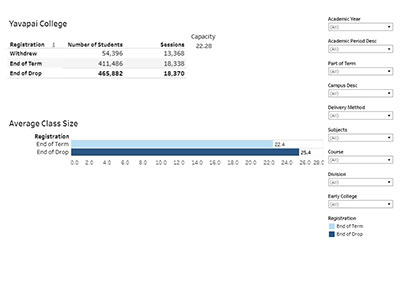
Average class size values are from the end of term and end of drop period. Class capacity is included. 2
Guided Pathways
Retention Outcome
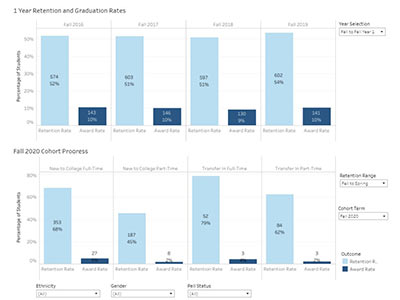
– Up to 4 years of fall to fall retention and graduation rates starting with the fall 2016 cohort.

Employee Demographics
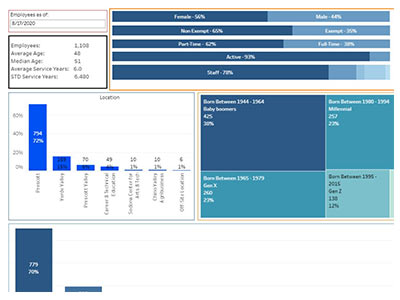
Employee demographics headcount as of August 17, 2020. Analyze the data by employee type, status, time-status, assigned campus, generation type, exemption type, gender, and race/ethnicity.